


Time-location chart
A time-location chart is a graphical representation of a construction program against axes of time and location (distance). It is a communication tool for project management that is used to inform a team about what needs to be done and when, as clearly and efficiently as possible.
Most construction planning and scheduling is carried out using bar charts, also known as Gantt charts. These charts plot activities against time, making them useful for knowing what to do at a specific time, however, they do not show where the work is being carried out. For civil engineering projects such as pipelines, railways, tunnels and roads, or repetitive projects such as housebuilding or high-rise building, it can be beneficial to chart activities against time and location.
A Gantt chart plots time on the horizontal axis and activities on the vertical axis. In contrast, a time-location chart is much less fixed. Location (distance) is often plotted on the horizontal axis and time on the vertical, although it varies as to whether it runs from the earliest down to the latest date or vice versa. Typically, charts for road and tunnel projects start at the top and progress downwards; whereas projects for buildings and pipelines start at the bottom and progress upwards.
Activities are shown as a line or shape (boxes or symbols) in the main body of the chart, making it possible to view the activities that will be taking place in which location at any particular time. The geometrical shapes show the occupation of the site over time, and ensure that conflicting access can be detected visually. Different types of activity are identified by specific colours, fill patterns, line types or special symbols. A key is used to clarify what the different symbols represent.
The advantage of a time-location chart is that it illustrates all visible activities along a construction site on a single chart. However, care must be taken not to include too much detail, as clarity can be lost in place of complexity, moving away from the purpose of the chart which is to make the construction programme easily understandable.
[edit] Related articles on Designing Buildings Wiki
- Activity schedule.
- Construction management.
- Contractor’s master programme.
- Critical path method.
- Design web.
- Gantt chart.
- Key performance indicators.
- Line of balance (LOB).
- Milestones.
- Pareto analysis.
- Programme float.
- Programme for building design and construction.
- Project programme.
- Resource management.
- Scheduling construction activities.
- Time management of construction projects.
Featured articles and news

Gregor Harvie argues that AI is state-sanctioned theft of IP.

Many resources for visitors aswell as new features for members.
Using technology to empower communities

The Community data platform; capturing the DNA of a place and fostering participation, for better design.
Heat pump and wind turbine sound calculations for PDRs

MCS publish updated sound calculation standards for permitted development installations.
Homes England creates largest housing-led site in the North

Successful, 34 hectare land acquisition with the residential allocation now completed.
Scottish apprenticeship training proposals

General support although better accountability and transparency is sought.
The history of building regulations

A story of belated action in response to crisis.
Moisture, fire safety and emerging trends in living walls

How wet is your wall?

Current policy explained and newly published consultation by the UK and Welsh Governments.
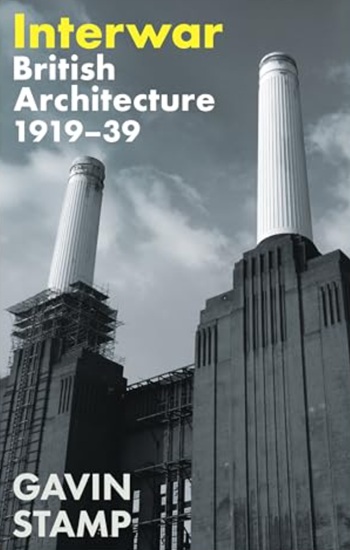
British architecture 1919–39. Book review.

Conservation of listed prefabs in Moseley.

Energy industry calls for urgent reform.

Heritage staff wellbeing at work survey.

A five minute introduction.
50th Golden anniversary ECA Edmundson apprentice award
![]()
Showcasing the very best electrotechnical and engineering services for half a century.
Welsh government consults on HRBs and reg changes
Seeking feedback on a new regulatory regime and a broad range of issues.
CIOB Client Guide (2nd edition) March 2025

Free download covering statutory dutyholder roles under the Building Safety Act and much more.